Hi,
I'd like to output frequency plots of trajectories in KML/KMZ for google earth, but I don't see that option in the GUI.
I'm running Hysplit in Linux
I tried with the scripts using concplot:
../exec/concplot -m0 -k1 -z90 -a3 -51 -jshapefiles_mexico.txt -itfreq.bin -oTrajResTime.ps
but the resulting file looks incomplete in Google Earth and includes a label regarding all the times in the file, which are related to the monthly run.
Nevertheless the image is static and don't change.
Could you please give some advice on how to create the file for google earth ?
Thank you in advance
Best
Frequency Plots in KML/KMZ format
Re: Frequency Plots in KML/KMZ format
Can you show what your KML file looks like as you said it is incomplete?
I output the frequency plot in 6.1 (https://www.ready.noaa.gov/documents/Tu ... req010.png) in KML format, using the command line like yours => ${MDL}/exec/concplot -m0 -k1 -z80 -a3 -51 -j${MDL}/graphics/arlmap -itfreq.bin -oTrajResTime.ps
It can generate the KML format for the Google Earth display =>
- Attachments
-
Re: Frequency Plots in KML/KMZ format
Hi
Attached is the image I got.
Not sure if it was because I used the shapefiles for Mexico.
Thank you for your help.
Best
Attached is the image I got.
Not sure if it was because I used the shapefiles for Mexico.
Thank you for your help.
Best
Re: Frequency Plots in KML/KMZ format
Using the Mexico shapefiles should not cause an issue writing out a KML file. Would you please try using the default background map "-j${MDL}/graphics/arlmap"?
Does the plot look right if you generate concplot.ps instead of the plot in KML format?
Does the plot look right if you generate concplot.ps instead of the plot in KML format?
Re: Frequency Plots in KML/KMZ format
Hi,
Thanks for your reply.
I changed to ARL map as suggested but unfortunately the plot still looks wrong, and exactly the same as before.
I double checked and transfered all the files (LABELS.CGF, gistmp_ps.txt GELABEL_ps.txt and resTimeCDMXMayARL.ps) that resulted from the concplot command, from the linux server to my local machine (Mac).
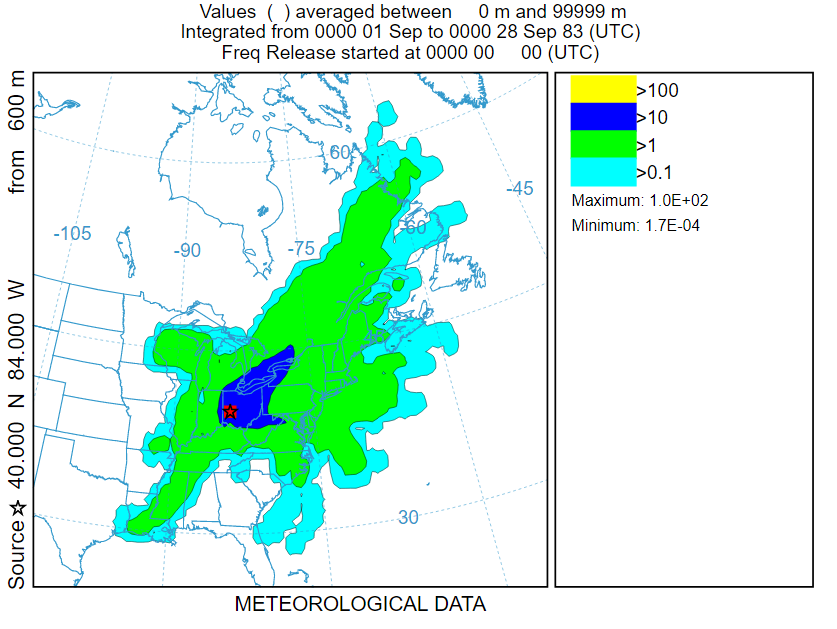
However, the concplot.ps looks rigth.
Please see the attached pictures
Thanks again
Best
Thanks for your reply.
I changed to ARL map as suggested but unfortunately the plot still looks wrong, and exactly the same as before.
I double checked and transfered all the files (LABELS.CGF, gistmp_ps.txt GELABEL_ps.txt and resTimeCDMXMayARL.ps) that resulted from the concplot command, from the linux server to my local machine (Mac).
However, the concplot.ps looks rigth.
Please see the attached pictures
Thanks again
Best
- Attachments
-
-