Frequency Plots in KML/KMZ format
Posted: June 17th, 2021, 7:28 pm
Hi,
I'd like to output frequency plots of trajectories in KML/KMZ for google earth, but I don't see that option in the GUI.
I'm running Hysplit in Linux
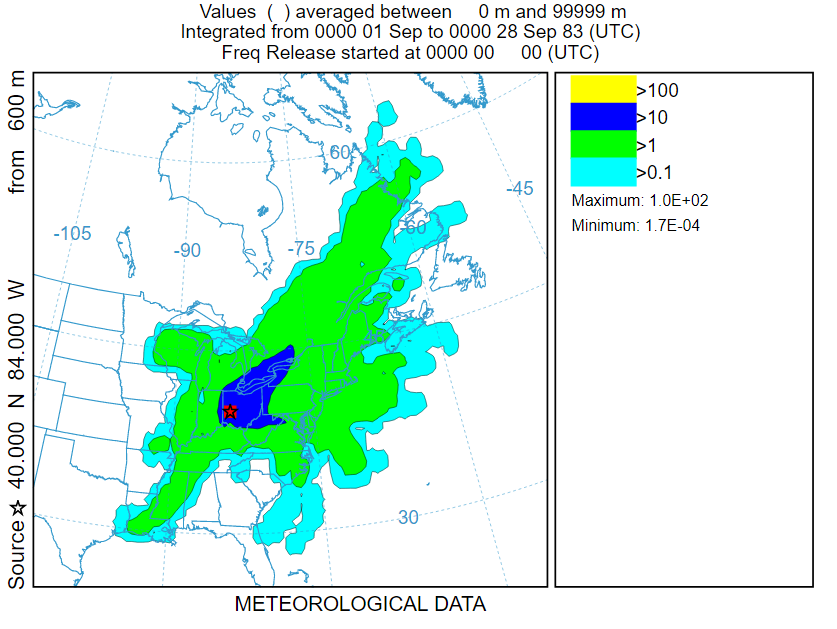
I tried with the scripts using concplot:
../exec/concplot -m0 -k1 -z90 -a3 -51 -jshapefiles_mexico.txt -itfreq.bin -oTrajResTime.ps
but the resulting file looks incomplete in Google Earth and includes a label regarding all the times in the file, which are related to the monthly run.
Nevertheless the image is static and don't change.
Could you please give some advice on how to create the file for google earth ?
Thank you in advance
Best
I'd like to output frequency plots of trajectories in KML/KMZ for google earth, but I don't see that option in the GUI.
I'm running Hysplit in Linux
I tried with the scripts using concplot:
../exec/concplot -m0 -k1 -z90 -a3 -51 -jshapefiles_mexico.txt -itfreq.bin -oTrajResTime.ps
but the resulting file looks incomplete in Google Earth and includes a label regarding all the times in the file, which are related to the monthly run.
Nevertheless the image is static and don't change.
Could you please give some advice on how to create the file for google earth ?
Thank you in advance
Best
