Page 2 of 3
Re: Clarification on meteorological data
Posted: December 6th, 2017, 7:37 am
by Pavan Aditya
sir/madam
In the plots, the units are referred to as 1.0E-14/m3. how to convert them into the daily used units of microgram/cubic meters?
Re: Clarification on meteorological data
Posted: December 6th, 2017, 9:08 am
by glenn.rolph
The three locations that the multiple trajectories in space create define the grid of trajectories that will be run by HYSPLIT. These 3 locations are the lower left point, the upper right point, and the third location sets the grid interval between the lower left point and this location. These three locations are defined in the CONTROL file. Then a program called latlon is run when you use the Trajectory/Special Runs Matrix pulldown menu these creates a new CONTROL file with all the grid locations to be run in the matrix defined by these 3 locations you initially defined. More information can be found in the help file located at: C:/hysplit4/html/S253.htm
Re: Clarification on meteorological data
Posted: December 6th, 2017, 9:12 am
by barbara.stunder
The basics are that the files CONTROL and at least one meteorology file are input to HYSPLIT. More advanced runs input a file SETUP.CFG. When following the Turtorial, and something doesn't work, re-read the relevant section, open your CONTROL, and if you have a SETUP.CFG, in a text editor (Notepad), and make sure they are the same as in the Tutorial.
Make sure you have the same model inputs to concplot in the GUI window "Concentration Display" as is generally shown in the Tutorial.
Use the links at the top: +/magnifying glass, C:\> (PC), and penguin (linux), to see exactly the GUI inputs, which programs are run, the command line parameters, and what is actually being run when you click on the various GUI buttons.
Re: Clarification on meteorological data
Posted: March 16th, 2018, 2:06 am
by Pavan Aditya
Sir/madam
I have downloaded the archived metrological file gdas 0.5deg resolution. I want to run a back trajectory analysis at 13 degrees N 85 degrees E location. How do I achieve this? Should I go to convert to ARL---> Global Lat lon and then set the desired coordinates? I have tried the same but It is showing an error as File missing------> Processing terminated.
please guide me in this regard.
Regards
pavan
Re: Clarification on meteorological data
Posted: March 16th, 2018, 8:45 am
by barbara.stunder
The archived gdas0.5 files are already in the format for input to HYSPLIT.
My suggestion is to start at the beginning. When you open the GUI, there are the choices
Meteorology, Trajectory, Concentration, Advanced
Exit, Reset, Help
Click "Reset"
Then do Trajectory / Run Model
and Trajectory / Display / Trajectory
Then go back to
Trajectory / Setup Run
Click "Clear" then "Add Meteorology Files" and select the gdas0.5 file.
Don't change the latitude or longitude or anything else.
Run the trajectory and plot it.
Then change the latitude, longitude, etc.
Re: Clarification on meteorological data
Posted: March 19th, 2018, 5:35 am
by Pavan Aditya
Sir/madam
how to find out the Height of Planetary Boundary Layer in the gdas file? I have used the Text Profile option but I am unable to see the HPBL option in the text box. Is it denoted by any other terminology?
Re: Clarification on meteorological data
Posted: March 19th, 2018, 9:08 am
by yaqiang
You can use MeteoInfoMap to explore the ARL data file. Or use MeteoInfoLab script to extract PBLH data at a specific location from GDAS data. An example script:
Code: Select all
lat = 40.0
lon = 120.5

fn = 'D:/Temp/arl/20140301_gdas0p5'
f = addfile(fn)
pblh = f['PBLH'][:,str(lat),str(lon)]

#Plot
plot(pblh, '-bo')
ylabel('PBLH (m)')
yticks(arange(0, 501, 100))
title('PBLH at (Lat: %.2f, Lon: %.2f)' % (lat, lon))
ylim(0, 500)
Result figure:
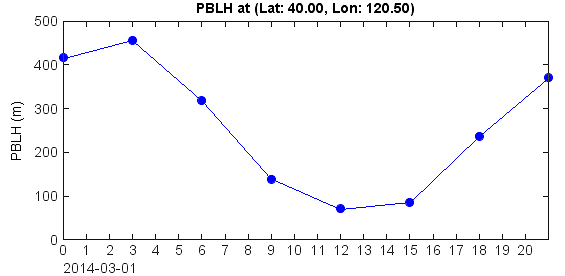
- arl_pblh.png (10.17 KiB) Viewed 6742 times
Re: Clarification on meteorological data
Posted: March 19th, 2018, 9:13 am
by barbara.stunder
See the readme files describing the archive at
https://www.ready.noaa.gov/archives.php then take another look at the text profile output.
Re: Clarification on meteorological data
Posted: March 20th, 2018, 2:53 am
by Pavan Aditya
Thank you very much. That helped a lot.
Re: Clarification on meteorological data
Posted: March 21st, 2018, 3:24 am
by Pavan Aditya
Sir/madam
I have a question regarding source geolocation.In the tutorial, a sampling data in form of DATEM format has been provided. How can I provide the same for my trajectory calculation? I have a GDAS file. Is it possible to obtain the data in a similar format?